Core Web Vitals Tools To Boost Your Web Performance Scores
The success of your website depends on the impression it leaves on its users. By optimizing your Core Web Vitals scores, you can gauge and improve user experience. Essentially, a web vital is a quality standard for UX and web performance set by Google. Each web vital represents a discrete aspect of a user’s experience. It can be measured based on real data from users visiting your sites (field metric) or in a lab environment (lab metric).
In fact, several user-centric metrics are used to quantify web vitals. They keep evoling, too: as there were conversations around slowly adding accessibility and responsiveness as web vitals as well. In fact, Core Web Vitals are just a part of this large set of vitals.
It’s worth mentioning that good Core Web Vitals scores don’t necessarily mean that your website scores in high 90s on Lighthouse. You might have a pretty suboptimal Lighthouse score while having green Core Web Vitals scores. Ultimately, for now it seems that it’s only the latter that contribute to SEO ranking — both on mobile and on desktop.
While most of the tools covered below only rely on field metrics, others use a mix of both field and lab metrics. 1
PageSpeed Compare
PageSpeed Compare is a page speed evaluation and benchmarking tool. It measures the web performance of a single page using Google PageSpeed Insights. It can also compare the performance of multiple pages of your site or those of your competitors’ websites. It evaluates lab metrics, field metrics, page resources, DOM size, CPU time, and potential savings for a website. PageSpeed Compare measures vitals like FCP, LCP, FID, CLS, and others using land and field data.
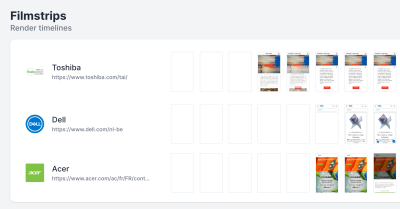
The report it generates lists the resources loaded by a page, the overall size for each resource type category, and the number of requests made for each type. Additionally, it examines the number of third-party requests and resources a page makes. It also lists cached resources and identifies unused Javascript. PageSpeed Compare checks the DOM of the page and breaks down its size, complexity, and children. It also identifies unused images and layout shifts in a graph.
When it comes to CPU time, the tool breaks down CPU time spent for various tasks, Javascript execution time, and CPU blocking. Lastly, it recommends optimizations you can make to improve your page. It graphs server, network, CSS, Javascript, critical content, and image optimizations to show the potential savings you could gain by incorporating fixes into your site. It gives resource-specific suggestions you could make to optimize the performance of your page. For example, it could recommend that you remove unused CSS and show you the savings this would give in a graph.
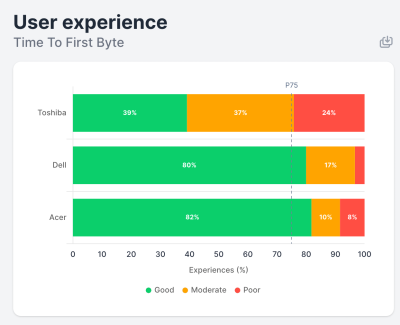
PageSpeed Compare provides web performance reports in a dashboard-alike overview with a set of graphs. You can compare up to 12 pages at once and presents the report in a simple and readable way since it uses PageSpeed Insights to generate reports. Network and CPU are throttled for lab data tests for more realistic conditions.
Bulk Core Web Vitals Check
Experte’s Bulk Core Web Vitals Check is a free tool that crawls up to 500 pages of the entire domain and provides an overview of the Core Web Vitals scores for them. Once the tool has crawled all the pages, it starts performing a Core Web Vitals check for each page and returns the results in a table. Running the test takes a while, as each web page test is done one at a time. So it’s a good idea to let it run for 15-30 mins to get your results.
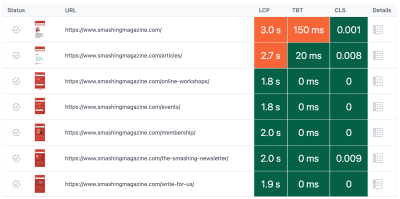
What’s the benefit then? As a result, you get a full overview of the pages that perform best, and pages that perform worst — and can compare the values over time. Under the hood, the tool uses Pagespeed Insights to measure Core Web Vitals.
You can export the results as a CSV file for Excel, Google Sheets or Apple Pages. The table format in which the results are returned makes it easy to compare web vitals across different pages. The tests can be run for both mobile and desktop.
Alternatively, you can also check David Gossage’s article on How to review Core Web Vitals scores in bulk, in which he shares the scripts and how to get an API key to run the script manually without any external tools or services.
Treo
If you’re looking for a slightly more advanced option for bulk Core Web Vitals check, this tool will cover your needs well. Treo Site Speed also performs site speed audits using data from the Chrome UX Report, Lighthouse and PageSpeed Insights.
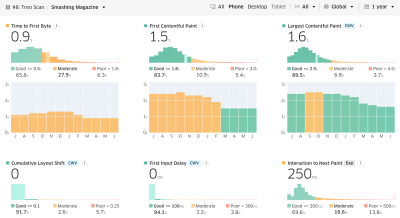
The audits can be performed across various devices and network conditions. Additionally though, with Treo, you can track the performance of all your pages across your sitemap, and even set up alerts for performance regressions. Additionally, you can receive monthly updates on your website’s performance.
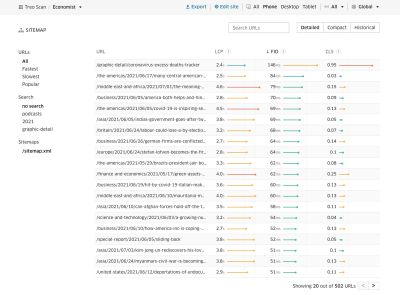
With Treo Site Speed, you can also benchmark a website against competitors. The reports Treo generates are comprehensive, broken down by devices and geography. They are granular and available at domain and page levels. You can export the reports or access their data using an API. They are also shareable.

WebPageTest Core Web Vitals Test
WebPageTest is, of course, a performance testing suite on its own. Yet one of the useful features it provides is a detailed breakdown of Core Web Vitals metrics and pointers to problematic areas and how to fix them.
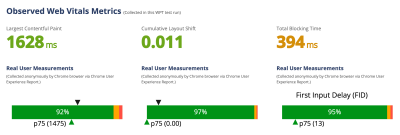
There are also plenty of Core Web Vitals-related details in the actual performance audit, along with suggestions for improvements which you can turn on without changing a line of code. For some, you will need a pro account though.
Cumulative Layout Shift Debuggers
Basically, the CLS Debugger helps you visualize CLS. It uses the Layout Instability API in Chromium to load pages and calculate their CLS. The CLS is calculated for both mobile and desktop devices and takes a few minutes to complete. The network and CPU are throttled during the test, and the pages are requested from the US.
The CLS debugger generates a GIF image with animations showing how the viewport elements shift. The generated GIF is important in practically visualizing layout shifts. The elements that contribute most to CLS are marked with squares to see their size and layout shift visually. They are also listed in a table together with their CLS scores.

Although the CLS is calculated as a lab metric initially, the CLS debugger receives CLS measurements from the Chrome UX Report as well. The CLS, then, is a rolling average of the past 28 days. The CLS debugger allows you to ignore cookie interstitials — plus, you can generate reports for specific countries, too.
Alternatively, you can also use the Layout Shift GIF Generator. The tool is available on its webpage or as a command line tool. With the CLI tool, you can specify additional options, such as the viewport width and height, cookies to supply to the page, the GIF output options, and the CLS calculation method.
Polypane Web Vitals
If you want to keep your Core Web Vitals scores nearby during development, Polypane Web Vitals is a fantastic feature worth looking into. Polypane is a standalone browser for web development, that includes tools for accessibility, responsive design and, most recently, performance and Core Web Vitals, too.
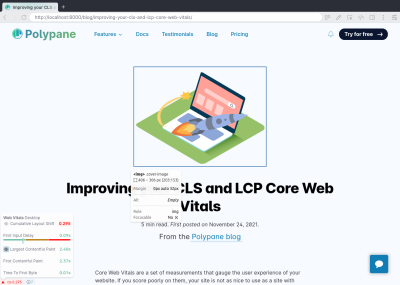
You can automatically gather Web Vitals scores for each page, and these are then shown at the bottom of your page. The tool also provides LCP visualization, and shows layout shifts as well.
Noteable Mentions
- Calibre’s Core Web Vitals Checker allows you to check Core Web Vitals for your page with one click. It uses data from the Chrome UX Report and measures LCP, CLS, FID, TTFB, INP and FCP.
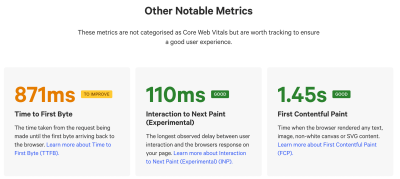
CrUX Compare is a little free tool that allows you to add a few sites and compare their Core Web Vitals scores side-by-side.
Web Vitals JavaScript library is a tiny library for measuring all the Web Vitals metrics on real users on your site.
An In-Depth Guide To Measuring Core Web Vitals is a guide by Barry Pollard on how to measure Core Web Vitals, detect issues and solve them, on Smashing Magazine.


 Check the frontend report!
 Take a break with a 3D game built on Netlify!
 Start with a free demo —
 Click here to kickstart your project for free in a matter of minutes.


