JavaScript Profiling With The Chrome Developer Tools
Little changes in your code can have gigantic performance impacts. A few lines here or there could mean the difference between a blazingly fast website and the dreaded “Unresponsive Script” dialog. This article shows you a few ways to find those lines of code with Chrome Developer Tools.
Further Reading on SmashingMag:
- How To Write Fast, Memory-Efficient JavaScript
- Testing Mobile: Emulators, Simulators And Remote Debugging
- Creating A “Save For Later” Chrome Extension With Modern Web Tools
- Revisiting Firefox’s DevTools
Establish A Baseline
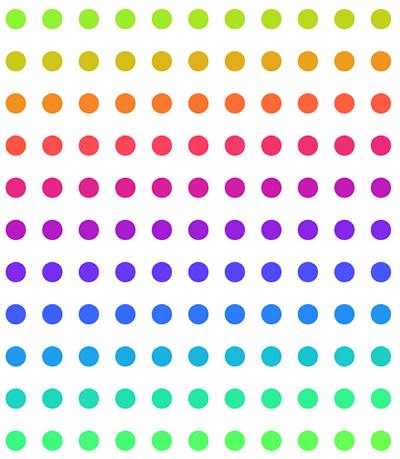
We’ll look at a simple application called a color sorter, which presents a grid of rainbow colors that you can drag and drop to mix up. Each dot is a div tag with a little CSS to make it look like a circle.
Generating my rainbow colors was a little tricky, so I got help from “Making Annoying Rainbows in JavaScript.”
The page loads pretty fast, but it still takes a moment and blinks a little before it paints. Time to profile the page and make it faster.
Always start performance-improvement projects with a baseline understanding of how fast or slow your application already is. The baseline will let you know whether you’re making improvements and help you make tradeoffs. For this article, we’ll use Chrome Developer Tools.
The profiler is part of Chrome Developer Tools, which is always available in Chrome. Click the “Tools” menu under the little wrench to open it. Firebug has some profiling tools, too, but the WebKit browsers (Chrome and Safari) are best at profiling code and showing timelines. Chrome also offers an excellent tool for event tracing, called Speed Tracer.
To establish our baseline, we’ll start recording in the “Timeline” tab, load our page and then stop the recording. (To start recording once Chrome Developer Tools is open, click the “Timeline” tab, and then the small black circle icon for “Record” at the very bottom of the window.) Chrome is smart about not starting to record until the page starts to load. I run it three times and take the average, in case my computer runs slowly during the first test.
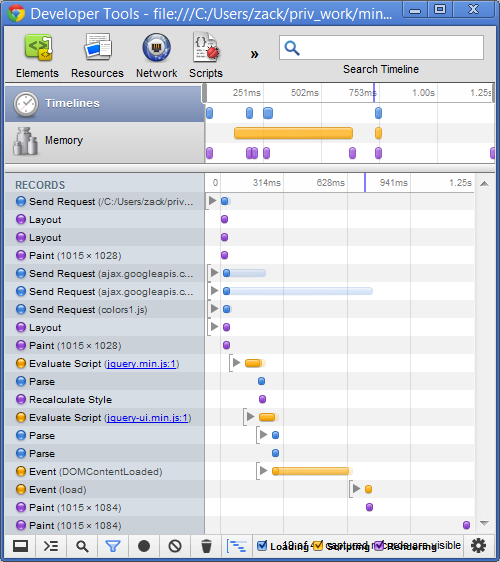
My average baseline — i.e. the time between the first request for the page and the final painting of the page in the browser — is 1.25 seconds. That’s not bad, but it’s not great for such a small page.
I want to make my code run faster, but I’m not sure what’s making it slow. The profiler helps me find out.
Create A Profile
The timeline tells us how long our code took to run, but that doesn’t help us know what’s going on while it’s running. We could make changes and run the timeline again and again, but that’s just shooting in the dark. The “Profiles” tab gives us a better way to see what’s going on.
Profilers show us which functions take the most time. Let’s make our baseline profile by switching to the “Profiles” tab in Chrome Developer Tools, where three types of profiling are offered:
- JavaScript CPU profile Shows how much CPU time our JavaScript is taking.
- CSS selector profile Shows how much CPU time is spent processing CSS selectors.
- Heap snapshot Shows how memory is being used by our JavaScript objects.
We want to make our JavaScript run faster, so we’ll use the CPU profiling. We start the profile, refresh the page and then stop the profiler.
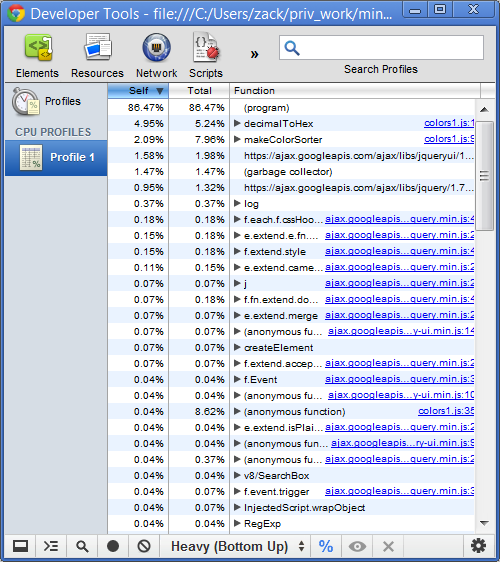
The first thing that’s clear from the profile is that a lot is going on. The color sorter uses jQuery and jQuery UI, which are doing a lot of stuff like managing plugins and parsing regular expressions. I can also see that two of my functions are at the top of the list: decimalToHex and makeColorSorter. These two functions take a total of 13.2% of my CPU time, so they’re a good place to start making improvements.
We can click the arrow next to the function calls to open the complete function-call stack. Expanding them, I see that decimalToHex is called from makeColorSorter, and makeColorSorter is called from $(document).ready.
Here’s the code:
$(document).ready(function() {
    makeColorSorter(.05, .05, .05, 0, 2, 4, 128, 127, 121);
    makeSortable();
});
Knowing where they’re called from also makes clear that making the colors sortable isn’t my biggest performance problem. Performance issues resulting from the addition of a lot of sortables is common, but my code is taking more time to add DOM elements than to make them sortable.
I want to start making those functions faster, but first I want to isolate my changes. A lot happens when the page loads, and I want to get all of that out of my profile.
Isolate The Problem
Instead of loading the color sorter when the document is ready, I’ll make a second version that waits until I press a button to load the color sorter. This isolates it from the document loading and helps me profile just the code. I can change it back once I’m done tuning performance.
Let’s call the new function testColorSorter and bind it to a clickable button:
function testColorSorter() {
    makeColorSorter(.05, .05, .05, 0, 2, 4, 128, 127, 121);
    makeSortable();
}
<button id="clickMe" onclick="testColorSorter();">Click me</button>Changing the application before we profile could alter the performance of the application unexpectedly. This change looks pretty safe, but I still want to run the profiler again to see whether I’ve accidentally changed anything else. I’ll create this new profile by starting the profiler, pressing the button in the app and then stopping the profile.
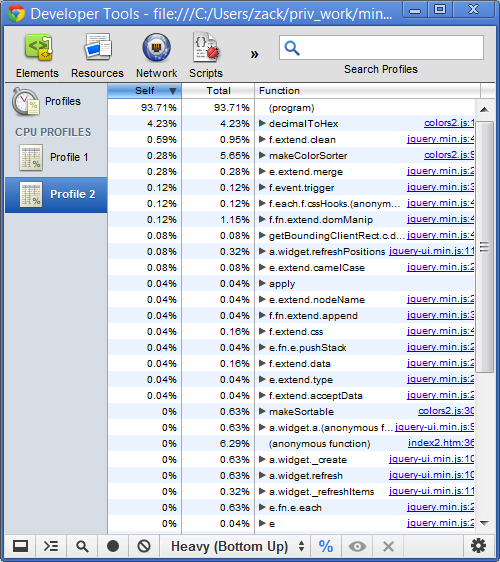
The first thing to notice is that the decimalToHex function is now taking up 4.23% of the time to load; it’s what the code spends the most time on. Let’s create a new baseline to see how much the code improves in this scenario.
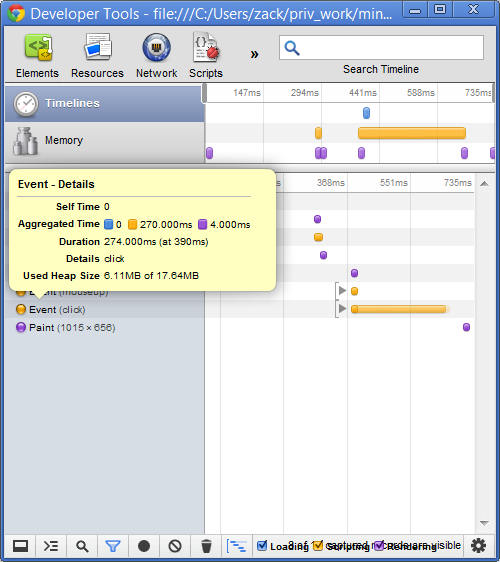
A few events occur before I press the button, but I only care about how long it took between the times the mouse was clicked and the browser painted the color sorter. The mouse button was clicked at 390 milliseconds, and the paint event happened at 726 milliseconds; 726 minus 390 equals my baseline of 336 milliseconds. Just as with the first baseline, I ran it three times and took the average time.
At this point, I know where to look and how long the code takes to run. Now we’re ready to start fixing the problem.
Make It Faster
The profiler only tells us which function is causing the problem, so we need to look into it and understand what it does.
function decimalToHex(d) {
    var hex = Number(d).toString(16);
    hex = "00".substr(0, 2 - hex.length) + hex;

    console.log('converting ' + d + ' to ' + hex);
    return hex;
}
Each dot in the color sorter takes a background color value in hex format, such as #86F01B or #2456FE. These values represent the red, green and blue values of the color. For example, ![]() has a background color of
has a background color of #2456FE, which means a red value of 36, a green value of 86 and a blue value of 254. Each value must be between 0 and 255.
The decimalToHex function converts these RGB colors to hex colors that we can use on the page.
The function is pretty simple, but I’ve left a console.log message in there, which is just some debugging code we can remove.
The decimalToHex function also adds padding to the beginning of the number. This is important because some base-10 numbers result in a single hex digit; 12 in base 10 is C in hex, but CSS requires two digits. We can make the conversion faster by making it a little less generic. I know that the numbers to be padded each have one digit, so we can rewrite the function like this:
function decimalToHex(d) {
    var hex = Number(d).toString(16);
    return hex.length === 1 ? '0' + hex : hex; }
Version three of the color sorter changes the string only when it needs the padding and doesn’t have to call substr. With this new function, our runtime is 137 milliseconds. By profiling the code again, I can see that the decimalToHex function now takes only 0.04% of the total time — putting it way down the list.
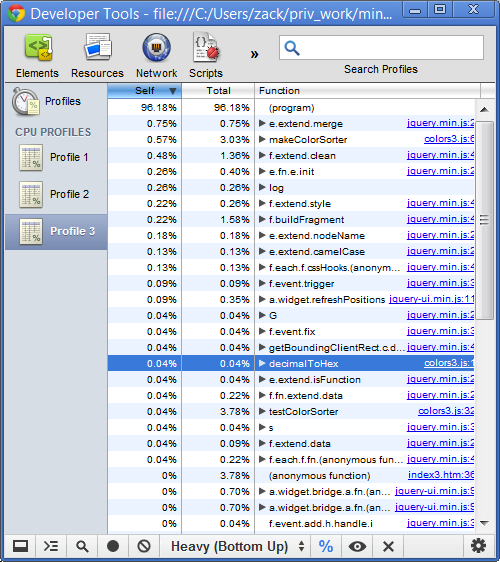
We can also see that the function using the most CPU is e.extend.merge from jQuery. I’m not sure what that function does because the code is minimized. I could add the development version of jQuery, but I can see that the function is getting called from makeColorSorter, so let’s make that one faster next.
Minimize Content Changes
The rainbow colors in the color sorter are generated from a sine wave. The code looks at a center point in the color spectrum and creates a wave through that center point over a specified width. This changes the colors into a rainbow pattern. We can also change the colors in the rainbow by changing the frequency of the red, green and blue.
function makeColorSorter(frequency1, frequency2, frequency3,
                         phase1, phase2, phase3,
                         center, width, len) {

    for (var i = 0; i < len; ++i)
    {
       var red = Math.floor(Math.sin(frequency1 * i + phase1) * width + center);
       var green = Math.floor(Math.sin(frequency2 * i + phase2) * width + center);
       var blue = Math.floor(Math.sin(frequency3 * i + phase3) * width + center);

       console.log('red: ' + decimalToHex(red));
       console.log('green: ' + decimalToHex(green));
       console.log('blue: ' + decimalToHex(blue));

       var div = $('<div class="colorBlock"></div>');
       div.css('background-color', '#' + decimalToHex(red) + decimalToHex(green) + decimalToHex(blue));
       $('#colors').append(div);

    }
}
We could take out more console.log functions. The calls are especially bad because each is also calling the decimalToHex function, which means that decimalToHex is effectively being called twice as often as it should.
This function changes the DOM a lot. Every time the loop runs, it adds a new div to the colors div tag. This makes me wonder whether that’s what the e.extend.merge function was doing. The profiler makes it easy to tell with a simple experiment.
Instead of adding a new div each time the loop runs, I want to add all of the div tags at once. Let’s create a variable to hold them, and then add them once at the end.
function makeColorSorter(frequency1, frequency2, frequency3,
                         phase1, phase2, phase3,
                         center, width, len) {

    var colors = "";
    for (var i = 0; i < len; ++i)
    {
       var red = Math.floor(Math.sin(frequency1 * i + phase1) * width + center);
       var green = Math.floor(Math.sin(frequency2 * i + phase2) * width + center);
       var blue = Math.floor(Math.sin(frequency3 * i + phase3) * width + center);

       colors += '<div class="colorBlock" style="background-color: #' +
           decimalToHex(red) + decimalToHex(green) + decimalToHex(blue) + '"></div>';
    }

    $('#colors').append(colors);
}
This small change in the code means that the DOM changes once, when it adds all of the div tags. Testing that with the timeline, we see that the runtime between the click and the paint events is now 31 milliseconds. This one DOM change has brought the time for version four down by about 87%. We can also run the profiler again and see that the e.extend.merge function now takes up such a small percentage of the time that it doesn’t show up on the list.
We could make the code one notch faster by removing the decimalToHex function entirely. CSS supports RGB colors, so we don’t need to convert them to hex. Now we can write our makeColorSorter function like this:
function makeColorSorter(frequency1, frequency2, frequency3,
                         phase1, phase2, phase3,
                         center, width, len) {

    var colors = "";
    for (var i = 0; i < len; ++i)
    {
       var red = Math.floor(Math.sin(frequency1 * i + phase1) * width + center);
       var green = Math.floor(Math.sin(frequency2 * i + phase2) * width + center);
       var blue = Math.floor(Math.sin(frequency3 * i + phase3) * width + center);

       colors += '<div class="colorBlock" style="background-color: rgb(' +
           red + ',' + green + ',' + blue + ')"></div>';
    }

    $('#colors').append(colors);
}
Version five runs in only 26 milliseconds and uses 18 lines of code for what used to take 28 lines.
JavaScript Profiling In Your Application
Real-world applications are much more complex than this color sorter, but profiling them follows the same basic steps:
- Establish a baseline so that you know where you’re starting from.
- Isolate the problem from any other code running in the application.
- Make it faster in a controlled environment, with frequent timelines and profiles.
There are a few other rules to follow when tuning performance:
- Start with the slowest parts first so that you get the most improvement for the time spent tuning.
- Control the environment. If you switch computers or make any other major changes, always run a new baseline.
- Repeat the analysis to prevent anomalies on your computer from skewing the results.
Everyone wants their website to run faster. You have to develop new features, but new features usually make a website run slower. So, investing time in tuning the performance does pay off.
Profiling and tuning cut the final color sorter’s runtime by over 92%. How much faster could your website be?
(al) (km)


 Celebrating 10 million developers
 Register Free Now

 SurveyJS: White-Label Survey Solution for Your JS App