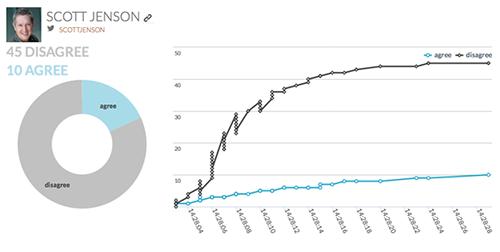
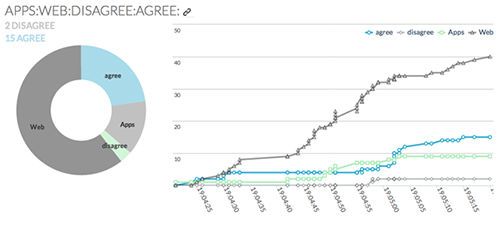
Reinventing The Tech Conference Experience
If you had to name one thing that could have been better at the last conference or meetup you attended, what would it be? I bet you’d say that the content or the interaction could have been better in some way. I created Onslyde to solve this problem. It’s a free service and open-source project that (hopefully) will make public speaking easier and conferences better.
The motivation for the project came from my own speaking engagements in the tech industry. I wanted to see how many people in the audience actually agreed or disagreed with what I was saying. I also wanted to leverage their experience and knowledge to create a better learning environment.
Presentations today are mostly unidirectional, with a single presenter giving information to the audience. But it doesn’t have to be that way. Now, with the ubiquity of mobile devices, everyone in the room can contribute to the conversation and make it better. Many books have been written on the topic of collective wisdom. In The Wisdom of Crowds, James Surowiecki states:
"… a diverse collection of independently deciding individuals is likely to make certain types of decisions and predictions better than individuals or even experts."
For the past year, I have been putting this thesis to the test, enabling people to interact with and change the content that I deliver. It’s been a lot of fun and work, and now you get to see the result.
Ratings And Feedback
When we look at current systems of rating and feedback at conferences, most of them are reactive, meaning that participants rate the session after it’s over. This is why most people don’t even rate sessions, unless they are asked or forced to by the doorkeeper. Those who do rate sessions might not care to be accurate (giving all 5s or 4s and then hurrying to the coffee line). Other attendees might have enjoyed the majority of the talk, but then got upset by the last slide or by the way the speaker ended the talk.
If these people decided to rate the presentation, how many stars do you think they would give? Perhaps 3 or 4 stars because of their anger at the end, but who really knows? Without context, a low rating doesn’t tell the speaker which part of the talk an attendee didn’t like.
Real-time feedback gives context to a rating, making traditional feedback unnecessary. Conference organizers and speakers no longer have to rely solely on Twitter hash tags and reactive ratings to see how well things went. We can now visualize exactly how the audience felt at any millisecond of a presentation.
Real-Time Ratings With Onslyde
Giving a presentation that allows for real-time feedback is like riding a bicycle down a really steep hill for the first time. You have no idea whether you will crash and burn or come out with an adrenaline-filled scream at the other end. And it’s just as much fun for the audience.
With Onslyde, you get an accurate measure from the audience while you’re speaking. If you see that a lot of people are disagreeing with what you’re saying, you can adapt: Ask audience members for their thoughts, or maybe move on to another topic. When you’re presenting, actually seeing how the audience collectively feels in real time and then responding accordingly is a very cool experience.
The worst thing a presenter can do is tell the audience something it already knows or say something totally wrong. The audience wants to be intrigued and entertained by you. But too many speakers seem to think this requires GIFs of cats. Well, I don’t want to spoil anyone’s fun but I’m an adult now, and I don’t go to thousand-dollar conferences to look at funny pictures of cats. I do want to be able to challenge you, engage with the content and tell you when you’re wrong.
So, let’s talk about how the audience indicates whether you’re right or wrong. Onslyde’s remote control gives audience members between two and four ways to interact, depending on the type of session. It works for both normal presentations and panel discussions.
For presentations:
- Any slide can be agreed or disagreed with.
- Presenters can poll the audience by asking a question and giving two answers to choose from.
- Remote devices are updated with content for each slide.
For panel discussions:
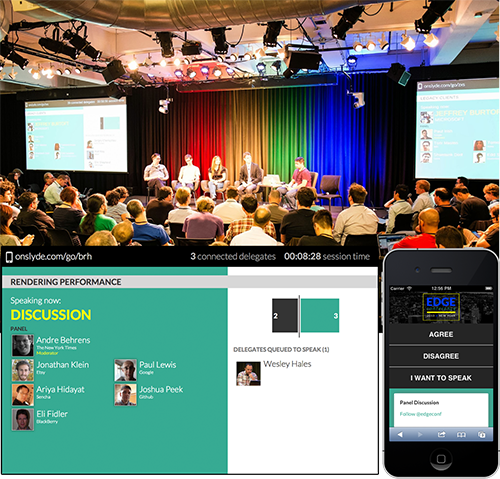
- Anyone (either panelist or audience member) can be agreed or disagreed with.
- Votes are on a rolling average, meaning that they expire after 15 seconds (or a time specified by the moderator).
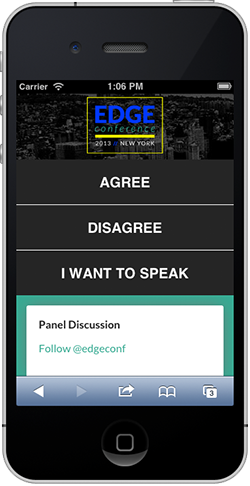
- Any audience member can request to speak. This option will add them to a queue on the main screen.
All remote devices receive real-time updates based on the slide or current speaker. In individual presentations, the speaker can specify content or images to send to all remotes per slide. For example, if a bulleted list is on the current slide, you could send it to the remotes by adding class=“send” to the markup:
<section class="slide">
    <ul class="send">
    <li>Onslyde makes you a better presenter.</li>
    </ul>
</section>
We’ll go over the technical details in the next section. For now, note how easy it is to broadcast markup to everyone’s remotes.
Edge Conf, hosted at Google’s New York office in October 2013, was the first time ever when the audience participated in real time (via Onslyde) during an entire conference.
What If There’s No Wi-Fi?
At this point, you might be thinking that this is a cool idea, but what about the 99% of conferences that have shaky or no Wi-Fi connectivity?
A presentation will work with or without an Internet connection; however, with no connection, it will just be like a normal presentation, and the audience would not be able to interact.
If you have a smartphone with a tetherable data plan, you can tether your laptop and enable Onslyde to connect from a mobile phone. It might sound crazy, but the lightweight messages that are sent across the wire still allow the presentation to run smoothly.
Even if Wi-Fi at a conference is unstable, the audience can always connect to the presentation with their mobile device’s data plan. I’ve personally given six or seven presentations with Onslyde and haven’t run into any issues so far.
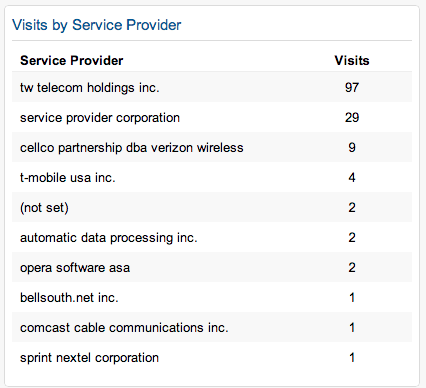
Below you can see the network statistics from a talk I gave earlier this year. Even though the conference had stable Wi-Fi, attendees were connecting through their mobile data plan:
Some have suggested bringing SMS into the picture, as a fallback. This would enable attendees to vote by sending text messages to the server. If you have other ideas, please leave them in the comments!
Building An Interactive Presentation
The Onslyde framework plugs into any HTML-based presentation system. For now, it supports presentations written with the following:
- RevealJS,
- Impress.js,
- Bespoke.js,
- plain HTML.
Currently, there is no nice WYSIWYG tool for building a slide deck. A tiny bit of HTML knowledge is required to build a presentation, but that’s it — no JavaScript or other programming. This is good because you don’t have to log into the system to edit your deck minutes before going on stage. You can change the markup at any time, and you will be ready to present after refreshing the browser.
The following use cases show how to add interactive elements to a presentation.
Audience Members Vote On (i.e. Agree Or Disagree With) Any Slide
This comes out of box, no set-up required. Onslyde is built around “slide groups.” “Agree” and “Disagree” votes can only be given once in a slide group. This lets you focus on a particular topic with multiple slides and not be bombarded with votes on each screen.
<section class="slide-group">
    <section class="slide">
        <p>Onslyde makes you a better presenter.</p>
    </section>
</section>
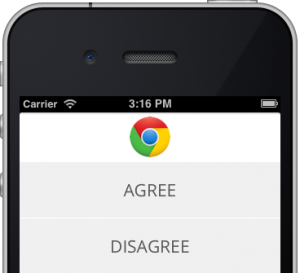
The buttons above will become active once the presenter moves to a new slide group.
Ask Unlimited Questions With Two Answers
To create an onscreen poll, use the following markup:
<section class="slide-group">

    <section class="slide" data-option="master">
        <h3 class="send">
        What is your favorite JavaScript framework?
        </h3>
    </section>

    <section class="slide" data-option="jquery">
        <div class="send">
        Time to talk about jQuery!
        </div>
    </section>

    <section class="slide" data-option="querySelector">
        <div class="send">
        Let’s go into more detail about core JavaScript!
        </div>
    </section>

</section>
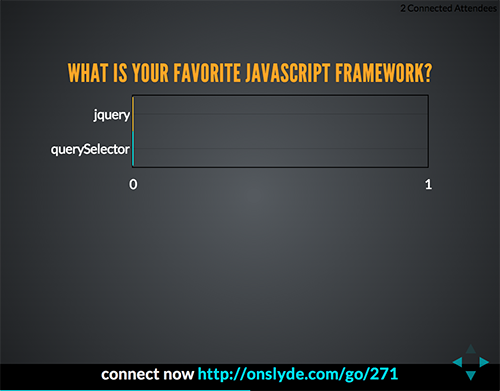
By adding the markup above to your presentation, the bar chart in the following image will be automatically created and populated as votes are submitted:
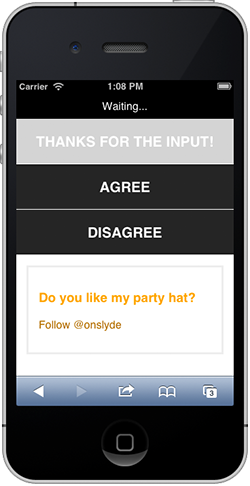
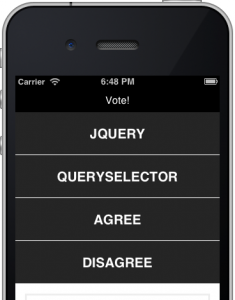
The buttons at the top will illuminate on the remote controls, and attendees may start voting:
Send Content To All Devices At Any Time
Notice how the remote control’s image shows the title of the poll? As mentioned, this is because we added class=“send” to the parent element of the heading.
<section class="slide">
    <h3 class="send">
    What is your favorite JavaScript framework?
    </h3>
…
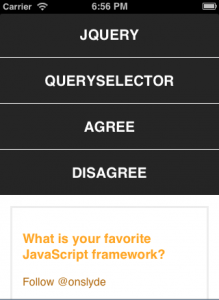
The sent markup will appear below the button options.
You can also send something completely different than what is shown by the projector. Instead of sending the title of the poll, you could send the names of other JavaScript libraries for attendees to research:
<section class="slide">
    <h3>
    What is your favorite JavaScript framework?
    </h3>

    <div class="none">
        <ul class="send">
        <li>Zepto</li>
        <li>xui</li>
        <li>…</li>
        </ul>
    </div>
Raffle Or Giveaway: Random Selection Of Audience Member
To me, one of the funnest parts of this tool is giving away swag at the end of a talk. You can randomly select anyone who is connected by adding the following link to your slide deck:
<a href="javascript:onslyde.slides.roulette()">Pick a winner</a>
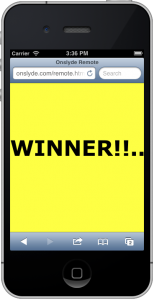
Just place the link on the final slide and click it at the end of your talk. Everyone’s mobile device will flash red; then, the winner’s will turn yellow. Continue clicking to pick more people at random.
Best Practices
The easiest way to get started with each feature is to focus on how you want the audience to interact with you and your content. Here are some good rules of thumb that I have learned using this tool:
- Start each presentation with a poll on the first or second slide. This allows the audience to get their device ready, get connected and start giving their opinion. It’s fun to pose a controversial question about your presentation topic and watch the votes pour in.
- Polls can solicit a “Yes” or “No” feeling from the audience or go deeper. If you ask a question like, “Which JavaScript framework do you use?” and then give options for “AngularJS” or “Backbone”, you will be able to fork the slides. This is why preparing the slides beforehand is more rewarding. Onslyde will detect the majority vote, and when you go to the next slide, the losing slides will be removed from the presentation (temporarily) and only the slides from the winning option will be shown.
Getting Started
Presentations can be created at onslyde.com. And the open-source back end that manages a presentation’s feedback is hosted on GitHub. Anyone can run the server and host their own instance of the entire Onslyde stack if they wish.
All of the features mentioned are integrated in each demo to show use cases. To begin your first presentation, go to the “Getting Started” section, where you will have the option to run a demo presentation or sign in and create a private one.
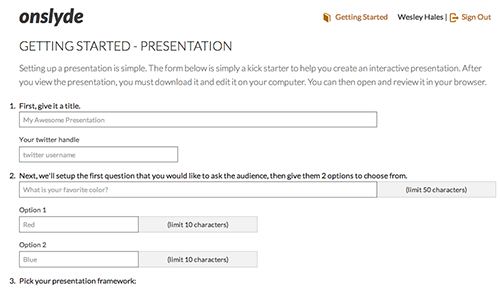
After you’ve signed in, the “Getting Started” page will give you options for setting up a poll. After hitting the “Preview” button, you must save the HTML to your computer in order to edit and present the slides.
An Onslyde presentation can be run anywhere. Essentially, it’s the same as saving a Keynote or PowerPoint presentation on your computer. Just click on the HTML file and run it from a Web browser — no need to install anything or run it from a server.
Regarding Keynote And PowerPoint
For those of you who use non-HTML slide decks, such as Keynote and PowerPoint, there are plans to create a transparent overlay on top of Windows and Mac OS X. This will allow presenters to use any presentation tool and to collect feedback in real time.
Understanding Audience Feedback
After your talk is over, you can view the analytics for your session. The votes for each slide are recorded so that you can track your performance at a fine-grained level.
For questions that the audience voted on, each option is recorded, along with the “Agree” and “Disagree” votes for each poll.
The other important pieces of data come from Google Analytics, including engagement times and what kinds of devices and mobile networks were used.
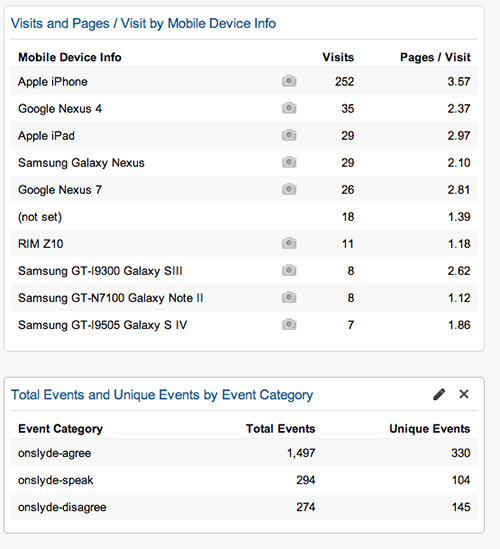
Google Analytics showed that real-time feedback was provided not just from the people in the room. (Large view)
From the above image, we can see that 281 iOS devices and approximately 113 Android devices were used at Edge Conf. Because the event was streamed live, over twice as many unique devices appeared as there were people in the room — people were participating and providing real-time feedback as they watched the live stream from their home or office around the world!
One other cool piece to this analytics puzzle is mapping voting times to the video. Edge Conf was streamed live, and the videos were subsequently added to YouTube. After finding a reference point in the video and calculating the starting time, we were able to map the charts to the videos. If you clicked on any data point from a session, the video would skip to that voting period. Try it out for yourself.
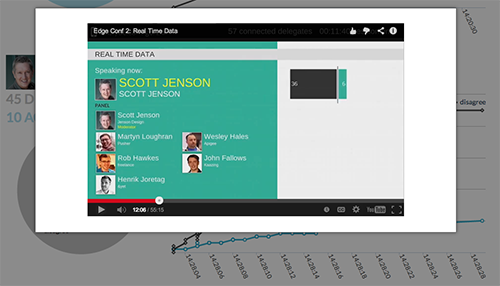
We were able to map the voting times to the conference videos. (Large view)
Conclusion
As we’ve seen, so much more valuable data can be pulled from the conferences we attend. Not only can we get an accurate snapshot of how speakers performed and how audience members felt, but we can change the learning experience for everyone.
This project is a use case for the mobile Web and a playground for the new technologies that are available to modern Web browsers, such as WebSockets and WebRTC. Many other companies and conferences provide similar services using native apps and proprietary hardware, but the convenience of opening a Web browser and being exposed to a new level of education and interaction is immeasurable.
Many thanks to Andrew Betts for helping me with this article and providing great feedback. He is also responsible for most of the features in the Onslyde panel and remote interfaces.
Further Reading
- Upcoming Web Design Conferences
- How To Plan And Run A Great Conference Experience
- Taking A Closer Look At Tech Conferences
- Smashing Conferences and Workshops



 Register now for WAS 2026
 Register for free to attend Axe-con

 SurveyJS: White-Label Survey Solution for Your JS App
 Celebrating 10 million developers