Finding Better Mobile Analytics
When creating a mobile application, a developer imagines a model and the way users will use the application. One problem that developers face is that users do not always use an app the way it was envisaged by the developer.
How do users interact with the app? What do they do in the app? Do they do what the developer wants them to do? Mobile analytics help to answer these questions. Analytics allow the developer to understand what happens with the app in real life and provide an opportunity to adjust and improve the app after seeing how users actually use it. To put it simply, analytics is the study of user behavior.
With this article, we will compare some of the most popular mobile analytics systems. The process of adding analytics to an app involves consideration of many details, and our aim is to provide you with useful tips on implementing analytics. This information should help you find a mobile analytics system that fits your needs and should help you to properly implement it in your app.
Analytics In Real Life
Let’s use as an example a small iOS application that we developed. It’s called What I Eat, and it’s intended to track the user’s eating habits.
Users can track their meals, check the daily meal log, and switch between days in the calendar to review previous logs. The application has an advertisement banner, but users can pay to disable it.
When designing What I Eat, our primary focus was to let the user easily add new meal records and easily review their daily history of meals. We also wanted to monetize the application with an in-app purchase to remove the advertisement. To understand whether we have managed to do this, we track the following events in the app:
- when the user starts the app the first time (application installation),
- when the user opens the daily meals list (main application screen),
- when the user adds a new meal record,
- when the user makes an in-app purchase to remove ads.
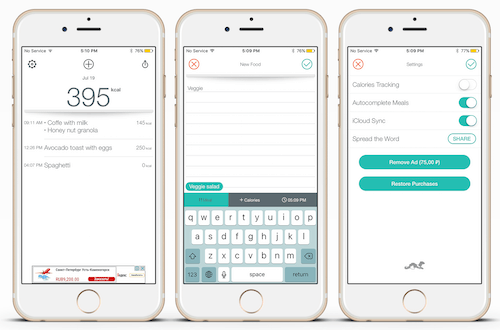
Later in this article, we will show how we use analytics to determine whether users have started using the app, and what percentage of users start tracking meals after installing the app.
Comparing Analytic Services
Today, plenty of analytics services are on the market, ranging from well-known systems such as Google Analytics to niche tools. Analyzing and comparing all of them would take forever; so, for this article, we will go with just those that we have found the most convenient. That is, we chose ones whose dashboard interface and data-mining toolbox are relatively easy to understand and easy to work with for those who do not have much experience with analytics, like our clients. As mobile-oriented analytics systems, they are also convenient from a development perspective because the analytics code can be easily implemented and tuned in a mobile app. Here are the systems:
To analyze how What I Eat performs, we use two main tools that almost every analytics system provides: events and funnels. Events describe what users do in the app, while funnels allows for a qualitative analysis of this data. Let’s examine how each of the systems implement these for What I Eat.
Mixpanel
Mixpanel allows you to track custom events. The developer can add custom parameters to the events and use these parameters to segment conversion funnels.
We built a funnel that includes two events: “Install” (which indicates the initial launch of the app after installation) and “Add Meal” (which tracks each time the user adds a meal). These show us what percentage of users not only downloaded the app but also started using it. The conversion is estimated at 65%, which means that out of 100 people who installed the app, as many as 65 started tracking meals.
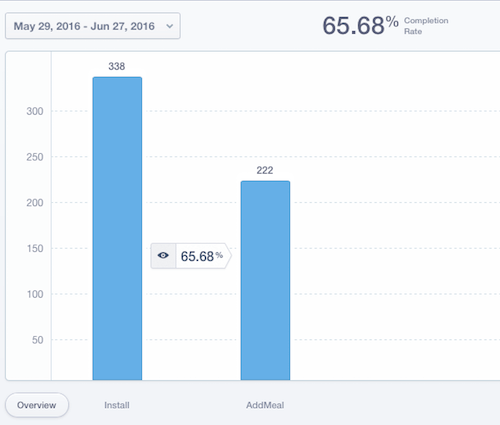
Sometimes a developer needs events to appear in the analytics dashboard in real time or with minimal delay after they have happened in the application. For example, a developer may have launched a social media marketing campaign and needs to track how it affects their application in real time. Mixpanel shows events almost in real time. Newly created funnels are calculated and visualized almost instantly.
Amplitude
Right after the developer adds Amplitude’s software development kit (SDK) to their project, and without any further set-up of events or funnels, the software starts tracking daily and monthly active users (DAU and MAU) data. We use that a lot in What I Eat to understand how many people use the app each day.
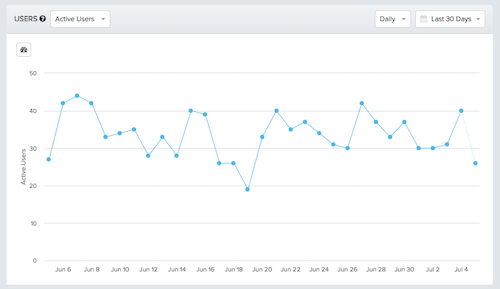
Like Mixpanel, Amplitude provides a powerful toolbox for working with events and funnels; the developer can create a funnel and segment it by parameters. Unlike Mixpanel, Amplitude can visualize segments directly in a funnel chart, which is handy when you need to understand how a parameter affects the conversion rate. The chart below shows how conversion from “Install” to “Add Meal” varies according to the interface’s language.
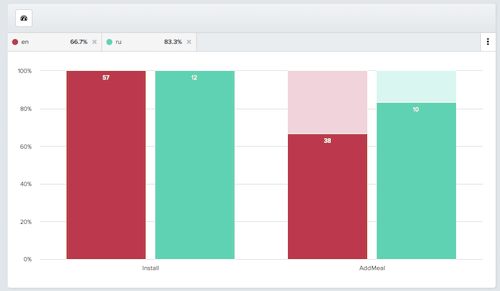
As you can see, the Russian interface shows better conversion than the English one (83% versus 66%). So, with our next app updates, we might need to look more at our non-Russian audience.
Answers By Crashlytics
As with Amplitude, once Answers’ SDK is added to the application project, it starts tracking data. With almost no effort from the developer, Answers provides an uncluttered view of some key performance indicators (KPIs) of the mobile application: MAU, DAU, daily new users and sessions.
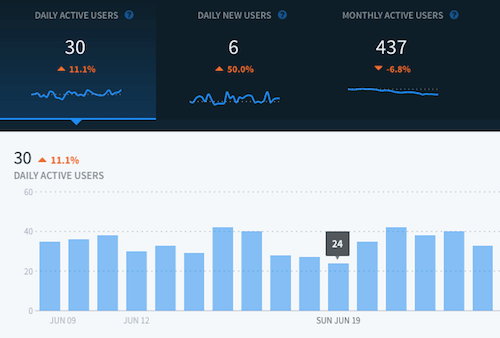
The developer can define and track custom KPIs as events, and Answers will visualize them in the same manner.
Answers also provides insights into how active your audience is and how much time people spend in the app.
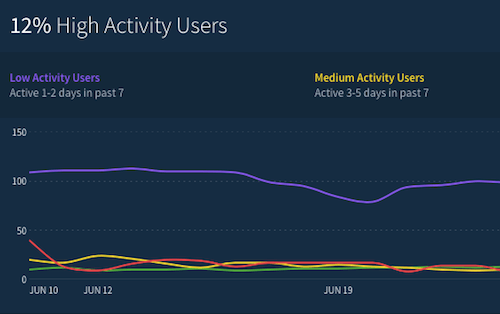
Answers’ analytics keeps data for the last 30 days, and it does not have funnels. Thus, it only works for simple and short-term analysis of an app’s performance.
Flurry By Yahoo
Flurry is not as handy as Mixpanel or Amplitude when you need to build funnels and do cohort analysis.
Flurry users can create up to 10 segments and apply them to a funnel. Adding a new segment to an existing funnel requires its recalculation, and this can take around one day. Users cannot create more than 10 segments to apply to their funnels. Calculations of newly created funnels can take up to three days.
We haven’t found Flurry’s events and funnels to be useful for What I Eat, and we mostly used Mixpanel and Amplitude.
What Else Is Important?
While events and funnels are key features, a few other things figure into choosing the right analytics system.
Demographic Data
Some of the analytic services provide insight data on the application’s audience, even if it is not collected in the app. They do that by getting user data from sources other than your mobile application. This comes in handy when you need to identify your power users but your application doesn’t collect any data about them. For example, in the What I Eat app, users don’t have to sign up and there is no other way that we can receive user data, but we would still like to know who uses it in order to accurately target new users with app updates.
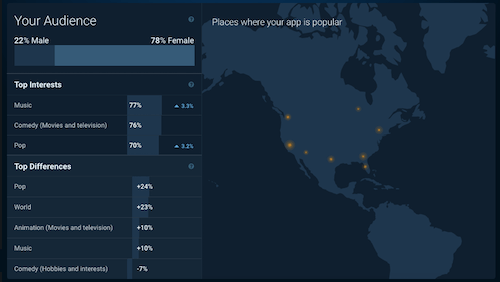
Answers provides data on your audience, such as their sex and interests. You might be wondering how it does that? Well, Answers is integrated closely with Twitter, and because Twitter knows just about everything about everybody who uses the platform, this personal data is leveraged by Answers.
Flurry estimates demographic data by approximating user information that it receives from the apps that have shared it. The reason why developers share this information is because they receive a more precise audience data set by providing insight data to Flurry. Flurry shows you your users’ interests, age range and sex.
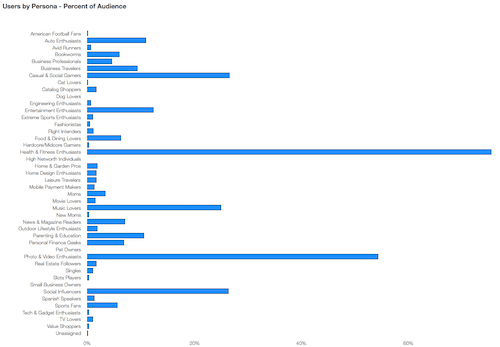
With the help of Flurry and Answers, we are able to see that What I Eat’s audience is mostly middle-aged women interested in health and fitness.
Mixpanel and Amplitude do not provide any demographic data.
External API For Importing And Exporting Data
Analytics allow for the importing and exporting of data through external APIs. Exporting allows for the analysis of data outside of the analytics dashboard (i.e. with the help of third-party data-mining software such as Windrush and DataHero). Importing APIs enable you to deploy data to analytics platforms from sources such as back-end servers and attribution-tracking systems such as AppsFlyer. Let’s examine which analytic services provide such functions:
- Amplitude provides an external API for both the importing and exporting of events.
- Mixpanel has importing and exporting APIs. It supports JavaScript Query Language to allow for complex exporting queries.
- Answers does not have an external API. You can download events data as a CSV file from the dashboard, but it does not include any event parameters.
- Flurry does not have an importing API. You can only export data using its exporting API.
Price
Mobile analytics companies experiment with pricing and may change their rates quite often. The following data is from July 2016:
- Flurry and Answers are completely free.
- Amplitudes’ free plan provides 10 million events per month. If you expect to track more than that, it will cost $2,000 per month. Although we’ve used Amplitude in quite a lot of projects, we’ve never had to switch to the paid tier because the free plan’s limits are also high.
- Mixpanel has a free tier of 25,000 events per month. One million events costs $300 per month. For more than 10 million events, you will have to pay $1,250 per month.
Analytics Implementation Tips
Now that we know the main differences between each analytics system, let’s dive into the practical aspects of implementing analytics.
Do Your Homework
If you have decided that you need analytics in your app, coding it is not the first thing you should think about. We believe a good developer should start with the following steps:
- Write down what you need to track. Start with composing a list of questions you want analytics to answer. Based on that list, lay out events and the parameters you need to track in order to answer the questions. Do not include analytics in the app for the sake of it.
- Rephrase it in terms of your analytics. Once you have completed your list of events, formalize it according to the analytics platform you’ve selected. For example, while Amplitude allows events with any set of parameters, Google Analytics has a predefined set of parameters. Take such nuances into account when implementing analytics.
- Make a small demo. A good idea would be to build a small test app, track a dozen events with its help and then check how these events are visualized in the platform of your choice and what data-mining instruments are available. Use this knowledge to maximize the selected platform’s functionality when implementing analytics in the live app.
Think Big When Coding
Design the analytics’ code to make it independent of the project’s code and analytics’ SDK. Thus, place the analytics code in a separate subsystem or class, and define interface methods that can be called from the application code. For example, when a user taps on a menu button, the application code would call the analytics class code. For an iOS app written in Swift, it would look like this:
/**
Application code: menu tap handler
*/
@IBAction func menuButtonPressed(sender: UIButton) {
    //Showing menu, etc...
    AnalyticsManager.sharedInstance.userTapMenuButton()
}
The general analytics class called by the application code collects a list of parameters and sends this data to the specific analytics class.
/**
General analytics class: a bridge between the application code and the specific analytics class
*/
class AnalyticsManager {
    static let sharedInstance = AnalyticsManager()

    private var services: [AnalyticsService]
    private init() {
        services = [AmplitudeAnalyticsService()]
    }

    func userTapMenuButton() {
        let name = "MenuTap"
        let properties: [String: AnyObject] = [/* define your properties */]
        for service in services {
            service.trackEvent(withName: name, properties: properties)
        }
    }
}
The specific analytics class sends data to the analytics SDK. In our case, it is Amplitude’s SDK.
/**
Specific analytics class.
*/
class AmplitudeAnalyticsService: AnalyticsService {
    func trackEvent(withName name: String, properties: [String : AnyObject]?) {
        if let propertiesToTrack = properties {
            Amplitude.instance().logEvent(name, withEventProperties: propertiesToTrack)
        } else {
            Amplitude.instance().logEvent(name)
        }
    }
}
With such a structure, whenever you decide to migrate to another analytics platform or adjust the set of parameters to track, you will only need to change the analytics class code but not the application code.
Analyze All Of Your Data
Collect data from all of the sources in the analytics platform of your choice. Send data not only from the mobile app but also from the back-end, using an external API. If you run an advertising campaign, use an installation-tracking system such as AppsFlyer or Adjust to measure its efficiency and to understand where your users are coming from. Select in advance the installation-tracking system you will use to make sure it works well with your analytics platform.
Control The Number Of SDKs
Try to use the analytics platforms’ SDKs that are already in the application. If you track crashes with Crashlytics, then you can use Answers’ analytics without any additional code, since both Crashlytics and Answers are included in the Fabric SDK. If your app allows registration with Facebook, then it already has the SDK that implements Facebook’s mobile analytics, so you might as well use it.
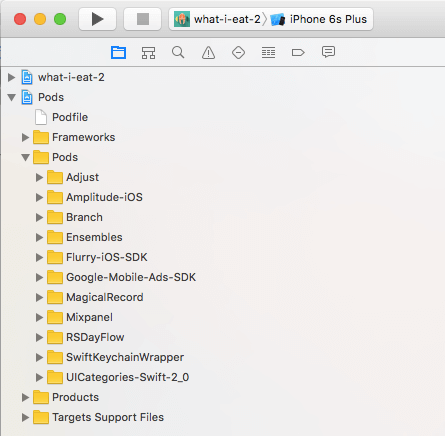
Try to combine different analytics systems, but do not overwhelm your application’s binary with too many SDKs.
Document It
Finally, in parallel with implementing analytics for your application, work on its documentation: write down what events and parameters you track and how you do it. For this, we usually use a Readme.md file that is stored in the core folder of the project. Each event is described by the following data:
- event name (for example, “User registration”);
- when tracked (for example, “Upon new user successful registration”);
- parameters (for example, “Email/String”);
- controller where tracking code is called (for example, “SignInController”).
Such details are easy to forget, but they become critical when you want to change the set of data to track or when you want to migrate to another analytics platform.
Summing Up
No analytics service is perfect; each has its pros and cons. When choosing one, you should weigh factors such as the application’s type, the analytics dashboard’s interface, your budget and so on. You might even want to use niche solutions, such as gaming analytics that have been created to analyze non-linear user experiences (for example, GameAnalytics) or developer-oriented analytics (for example, Keen IO).
We found a combination of Answers and Amplitude to work perfectly with What I Eat and to provide all necessary analytics for the app. While Answers is free and shows demographics data and app KPIs, Amplitude allows for more complex behavioral cohort analysis. We also track application crashes with Answers’ Fabric SDK.
We would love to hear about the analytics toolbox you use in your mobile application. Please share your ideas in the comments.
Further Reading
- Prioritizing Devices: Testing And Responsive Web Design
- Noah’s Transition To Mobile Usability Testing
- Where Are The World’s Best Open Device Labs?
- A Guide To Simple And Painless Mobile User Testing


 Register for free to attend Axe-con
 Celebrating 10 million developers

 SurveyJS: White-Label Survey Solution for Your JS App

