Using Social Media For User Research
In the commercial sector, social media is a source of data about users that often gets ignored in favor of other more controlled user research activities, such as interviews and user testing. (Though, it is often used to recruit participants for these traditional methods.) Conversely, in the academic world, social media was immediately recognized as an interesting primary source of data. But it has been typically addressed with quantitative research methods, such as visualizing information flows between network members and graphing peaks of activity, which are not so relevant in most typical user research projects.
In recent years, a range of commercially available monitoring software tools have emerged to make it relatively easy to track a range of keywords and capture a wealth of tweets, posts and mentions on topics of interest. However, these tools are also principally set up to do sentiment analysis, such as whether brand mentions are broadly positive or negative. But these high-level insights come at the expense of the nuanced details that reside in the individual tweets, posts and mentions. So, how can we do useful user research with social media?
Research Gold
Social media platforms enable social listening. We can tap into the recent or “in the moment” experience of real issues in context, rather than asking people, for example, to recall experiences in a face-to-face interview that takes place a week afterwards. It is particularly well suited to researching instances of mundane, everyday activities (such as smartphone habits) that would otherwise be poorly remembered and inaccessible to the researcher in the lab or to popular services that have already been launched. And when we tap in, we get data in the users’ language, not the language of the researcher. This amounts to research gold, and all we need is to get a pan and jump into the river. (There are some things to be aware of, of course, which I will describe later.)
A Case Study From Highways England
While working as a user researcher for Highways England, I created the user research with social media technique that I describe here. This was part of a wide-ranging user research project to make wholesale improvements to the Dart Charge service. This is a highly used GOV.UK service that enables over 5 milion drivers to pay remotely to use a part of the UK’s M25 motorway network in outer London, called the Dartford Crossing, where the motorway crosses the River Thames. A key research challenge was to understand user needs around paying before or after using the Dartford Crossing. Many other typical user research methods were used on this project, including user testing sessions and interview studies, but the service team welcomed new ideas for gaining research insights, particularly those relating to routine activities such as driving, because it was felt these were not well captured by the other types of research being done.
The sources chosen were Facebook and Twitter on account of their popularity in the UK among the 5 million users of the Dart Charge service. Salesforce’s Radian 6 (now part of Social Studio) was chosen because it supports tracking of multiple keywords across multiple social networks. We selected the month of August 2015, mainly because it was the most recent full month and gathered around a thousand mentions. It was also felt to be the maximum amount of data the team could analyze in the time available.
Ultimately, this resulted in 39 insights, which were added to the product backlog at the time of the research. The four steps in this technique were:
- define keywords to monitor,
- choose a tool,
- gather data,
- analyze for insight.
How To Do User Research With Social Media
1. Define Keywords To Monitor
This first step is about setting up the search query, or queries, that are going to be used. These could be user accounts, hash tags and phrases. A good place to start is to gather the project’s team together and collate all of the ways they think real people might refer to the product or situation of interest.
In the case of Highways England, we identified 10 target phrases, hash tags and accounts. Notably, some of these were official terms for the service, such as Dart Charge and Dartford Crossing, and some were unofficial but widely used, such as Dartford Tunnel and Dartford Toll. Examples of the phrases, hash tags and accounts we used are in the table below:
| Phrases | Hash tags | Accounts |
|---|---|---|
| “Dart charge,” “Dartford Tunnel,” “Dartford Toll,” “Dartford Crossing” | #dartfordcrossing, #dartcharge, #dartfordbridge | @dartcharge, @dartfordtoll, @dartfordtraffic |
2. Choose A Tool
A variety of tools are available to gather social media data, including free tools and some very expensive one. A good place to start is with the search facilities within the social media networks themselves, because they provide the opportunity to gather data at no cost. These search tools have their drawbacks. For example, Facebook’s groups and privacy settings make it more difficult to search than Twitter, which is much more open. So, choose a social media network that your users, or prospective users, are using, and then start gathering data.
Once you are familiar with this research technique, you can come back to the decision of whether to spend money on other tools. Some, such as Hootsuite, Sprout Social, DiscoverText and IBM’s Watson Analytics, charge a monthly fee. Others, such as Salesforce’s Social Studio, Sysomos and Oracle’s Social Cloud, don’t even show the price. You have to email them for a demo and a quote. (It is a bit like being in a shop where the expensive clothes don’t have price tags on them!)
3. Gather Data
Once you have chosen a tool, gathering data is relatively straightforward. Let’s start with using the free search tool within Twitter. It is a process of running a search and saving the search results. But a few tips are worth bearing in mind.
First, you don’t even need a Twitter account. You can just head over to the Advanced Search tool and enter your keywords directly. Facebook is not so easy to access.

Secondly, defining the date range covered by your data sample is always smart (in case you, or others, want to repeat it). You can set a date range using the “since” and “until” commands in Twitter.
Thirdly, you can save a PDF of the search results via the print menu in your browser. This is worth doing because deleted tweets will disappear from results (when the user deletes them), so you would lose them otherwise. You will also need to manually expose conversations, because these are hidden by default (and will not be shown in your PDF).
4. Analyze For Insight
There are many ways to analyze the qualitative data we have just gathered. In a nutshell, really, what we are doing at this stage is sense-making. We are asking, What does this piece of data really mean? More or less, it is a case of taking stock of any individual piece of data (for example, a tweet or post) and annotating it with additional words (sometimes called tags or codes) that encapsulate what is being meant. If there are items in the data sample that are hard to understand or incomplete or irrelevant, skipping over them is OK. (Likewise, skip any that appear to be from fake accounts or are the work of trolls.) Typically, only around 1 in 10 items in the data sample might actually be annotated with tags. Practically, this can be done by printing out the PDF data set and using a highlighter pen to mark up interesting pieces of data and writing the tags beside the data.
Once all of the interesting items in the data sample have been tagged, it is effective to pull out only the tagged items and group any related items together. This is a process of affinity-sorting. Again, practically, this can be done by cutting up the print-outs and spatially rearranging the affinity groups. Seeing different perspectives on the same issue helps to form a rounded insight, as we can see in these examples from our Highways England project. Some example tweets and how they were tagged are shown in the images below:


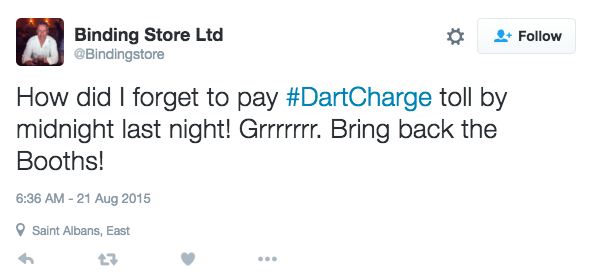
Taking stock of just these four tagged data items, we can get to the following insights about user needs and values:
- There is a user need to avoid forgetting to pay and to get a reminder.
- There is a value to users in avoiding financial penalty and associated stress.
Ideally, the best way to do this sort of analysis is to have a fellow team member involved in the tagging, affinity-sorting and insight generation. If you see different things in the same piece of data, that is good, not bad, because a richer and more nuanced interpretation emerges. (Afterwards, long-term management of the analysis can be supported by transferring the data items and their associated tags into digital tools, such as NVivo or Reframer.)
When To Use This Technique (And When Not To)
The technique of doing user research with social media is particularly well suited to certain project situations:
- when there is a wide focus on a particular service, such as a discovery or requirements-gathering phase;
- when there is no budget for recruitment or a venue, or no time to wait for the recruitment to be organized;
- when you need to do some design research to understand the context of use;
- when you have run out of ideas of what to do next.
It is not so well suited to other common project situations:
- when you need to test a prototype that is not publicly available;
- when there is a highly focused brief (or worse solution) that is not up for debate;
- when you are fixing something clearly broken, such as a siloed information architecture;
- when you are optimizing something that works OK for users, such as a shopping basket and checkout.
Things To Be Aware Of
Social media research offers many benefits to the user researcher, but there are some things to be aware of. Getting up and running is quick, and you don’t have to wait to recruit participants or need any prior hypotheses. Indeed, because the users are expressing themselves in public, they are not participants, so there are no data-protection issues to concern anyone. Nor are there any demand characteristics biases that would mean the participants are politely trying to please the researchers.
But these advantages do need to be balanced with the disadvantages. Is the data clear enough to understand? Are we interpreting the data to fit the questions we ask? Are we just sampling social media users and not everyone else? Are we getting only the most positive and negative voices (and none from the middle)? Are we seeing self-reported behavior, not real behavior? Are we prone to other cognitive biases in the data, such as researchers just seeing the things that are easiest to see (the availability bias) or participants overemphasizing the most intense or most recent aspects of their experience (the peak-end effect)? The answer is, of course, “Yes, but…!”
Ultimately, it is poor practice to rely on one research technique to answer any given question and lay yourself open to criticism of the shortcomings of that technique. It is always best to have multiple research techniques that address the same objective from different angles. This enables a team to notice the different biases at play in each research technique and to come to a rounded view of users’ needs and the best course of action in the design stage.
Conclusion
Social media provides a rich source of data for user researchers. It allows researchers to tap into the recent experience of people without the formality of interviewing or user testing. And while it is not without its disadvantages, it is illuminating, and you can get started for free. It helped Highways England realize the importance of the issue of forgetting to pay. So, why not add user research with social media to your toolbox and see what you find?
Additional Resources
- Twitter The Advanced Search tool is a good place to start.
- Hootsuite Allows monitoring streams of up to three keywords. A range of apps and integrations can be added on.
- Sprout Social Power up your keyword monitoring.
- DiscoverText Throw some machine learning at your data to speed up analysis.
- IBM Watson Analytics Throw some science at your data and see it visually.
- Radian 6 Now part of Social Studio. Aimed at marketers.
- Sysomos Been around a long time. Aimed at marketers.
- Oracle Social Cloud Offers to automatically cut out irrelevant data.
Front page image credit: Pexels.
Further Reading
- A 5-Step Process For Conducting User Research
- A Closer Look At Personas: What They Are And How They Work
- Incorporating Social Identity Theory Into Design
- How Copywriting Can Benefit From User Research


 Register for free to attend Axe-con

 Register now for WAS 2026
 Celebrating 10 million developers
 SurveyJS: White-Label Survey Solution for Your JS App

