How To Monitor And Optimize Google Core Web Vitals
This article has been kindly supported by our dear friends at DebugBear, who help optimize web performance to improve user experience. Thank you!
Google’s Core Web Vitals initiative has increased the attention website owners need to pay to user experience. You can now more easily see when users have poor experiences on your website, and poor UX also has a bigger impact on SEO.
That means you need to test your website to identify optimizations. Beyond that, monitoring ensures that you can stay ahead of your Core Web Vitals scores for the long term.
Let’s find out how to work with different types of Core Web Vitals data and how monitoring can help you gain a deeper insight into user experiences and help you optimize them.
What Are Core Web Vitals?
There are three web vitals metrics Google uses to measure different aspects of website performance:
- Largest Contentful Paint (LCP),
- Cumulative Layout Shift (CLS),
- Interaction to Next Paint (INP).

Largest Contentful Paint (LCP)
The Largest Contentful Paint metric is the closest thing to a traditional load time measurement. However, LCP doesn’t track a purely technical page load milestone like the JavaScript Load Event. Instead, it focuses on what the user can see by measuring how soon after opening a page, the largest content element on the page appears.
The faster the LCP happens, the better, and Google rates a passing LCP score below 2.5 seconds.

Cumulative Layout Shift (CLS)
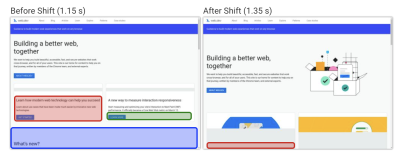
Cumulative Layout Shift is a bit of an odd metric, as it doesn’t measure how fast something happens. Instead, it looks at how stable the page layout is once the page starts loading. Layout shifts mean that content moves around, disorienting the user and potentially causing accidental clicks on the wrong UI element.
The CLS score is calculated by looking at how far an element moved and how big the element is. Aim for a score below 0.1 to get a good rating from Google.
Interaction to Next Paint (INP)
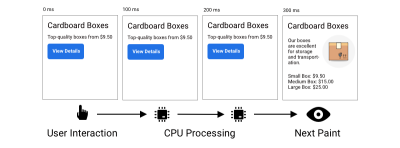
Even websites that load quickly often frustrate users when interactions with the page feel sluggish. That’s why Interaction to Next Paint measures how long the page remains frozen after user interaction with no visual updates.
Page interactions should feel practically instant, so Google recommends an INP score below 200 milliseconds.
What Are The Different Types Of Core Web Vitals Data?
You’ll often see different page speed metrics reported by different tools and data sources, so it’s important to understand the differences. We’ve published a whole article just about that, but here’s the high-level breakdown along with the pros and cons of each one:
- Synthetic Tests
These tests are run on-demand in a controlled lab environment in a fixed location with a fixed network and device speed. They can produce very detailed reports and recommendations. - Real User Monitoring (RUM)
This data tells you how fast your website is for your actual visitors. That means you need to install an analytics script to collect it, and the reporting that’s available is less detailed than for lab tests. - CrUX Data
Google collects from Chrome users as part of the Chrome User Experience Report (CrUX) and uses it as a ranking signal. It’s available for every website with enough traffic, but since it covers a 28-day rolling window, it takes a while for changes on your website to be reflected here. It also doesn’t include any debug data to help you optimize your metrics.
Start By Running A One-Off Page Speed Test
Before signing up for a monitoring service, it’s best to run a one-off lab test with a free tool like Google’s PageSpeed Insights or the DebugBear Website Speed Test. Both of these tools report with Google CrUX data that reflects whether real users are facing issues on your website.
Note: The lab data you get from some Lighthouse-based tools — like PageSpeed Insights — can be unreliable.
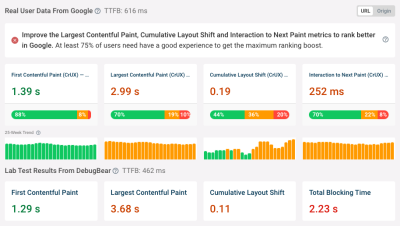
INP is best measured for real users, where you can see the elements that users interact with most often and where the problems lie. But a free tool like the INP Debugger can be a good starting point if you don’t have RUM set up yet.
How To Monitor Core Web Vitals Continuously With Scheduled Lab-Based Testing
Running tests continuously has a few advantages over ad-hoc tests. Most importantly, continuous testing triggers alerts whenever a new issue appears on your website, allowing you to start fixing them right away. You’ll also have access to historical data, allowing you to see exactly when a regression occurred and letting you compare test results before and after to see what changed.
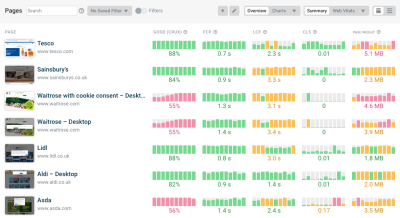
Scheduled lab tests are easy to set up using a website monitoring tool like DebugBear. Enter a list of website URLs and pick a device type, test location, and test frequency to get things running:
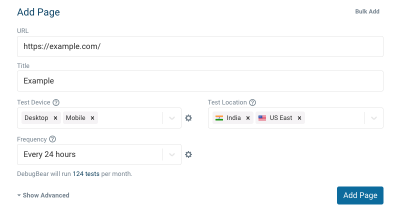
As this process runs, it feeds data into the detailed dashboard with historical Core Web Vitals data. You can monitor a number of pages on your website or track the speed of your competition to make sure you stay ahead.
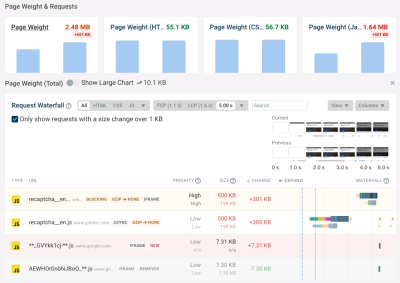
When regression occurs, you can dive deep into the results using DebuBears’s Compare mode. This mode lets you see before-and-after test results side-by-side, giving you context for identifying causes. You see exactly what changed. For example, in the following case, we can see that HTTP compression stopped working for a file, leading to an increase in page weight and longer download times.
How To Monitor Real User Core Web Vitals
Synthetic tests are great for super-detailed reporting of your page load time. However, other aspects of user experience, like layout shifts and slow interactions, heavily depend on how real users use your website. So, it’s worth setting up real user monitoring with a tool like DebugBear.
To monitor real user web vitals, you’ll need to install an analytics snippet that collects this data on your website. Once that’s done, you’ll be able to see data for all three Core Web Vitals metrics across your entire website.
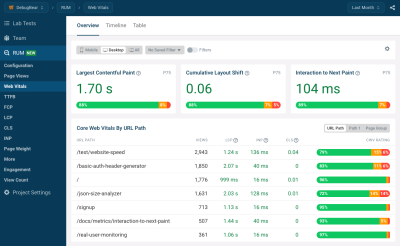
To optimize your scores, you can go into the dashboard for each individual metric, select a specific page you’re interested in, and then dive deeper into the data.
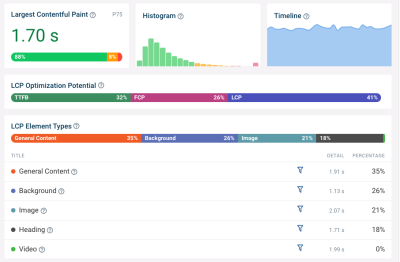
For example, you can see whether a slow LCP score is caused by a slow server response, render blocking resources, or by the LCP content element itself.
You’ll also find that the LCP element varies between visitors. Lab test results are always the same, as they rely on a single fixed screen size. However, in the real world, visitors use a wide range of devices and will see different content when they open your website.
INP is tricky to debug without real user data. Yet an analytics tool like DebugBear can tell you exactly what page elements users are interacting with most often and which of these interactions are slow to respond.
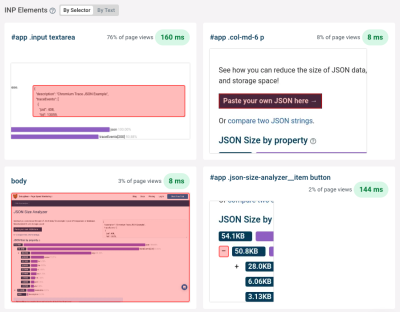
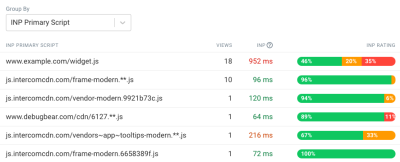
Thanks to the new Long Animation Frames API, we can also see specific scripts that contribute to slow interactions. We can then decide to optimize these scripts, remove them from the page, or run them in a way that does not block interactions for as long.
Conclusion
Continuously monitoring Core Web Vitals lets you see how website changes impact user experience and ensures you get alerted when something goes wrong. While it’s possible to measure Core Web Vitals using a wide range of tools, those tools are limited by the type of data they use to evaluate performance, not to mention they only provide a single snapshot of performance at a specific point in time.
A tool like DebugBear gives you access to several different types of data that you can use to troubleshoot performance and optimize your website, complete with RUM capabilities that offer a historial record of performance for identifying issues where and when they occur. Sign up for a free DebugBear trial here.

